Own Gold with Reason into Bank Failure Season
 share
share
 share
share
 share
share
 share
share
 share
share
Not to overly dwell — let alone predict — by subject title, however if we search our recollect (thank you Ken Starr), was it not by this time a year ago that we’d witnessed a few banks go? Whilst not first, First Republic failed. And now a year hence, Republic First has failed. How palindromic its that? Or from the “What’s in a Numerological Name Dept.” ought we now be concerned about Old Second National, or dare we say, Fifth Third? (Not to panic as both those two institutions appear quite solvent, whereas New York’s Fourth National went defunct 110 years ago, but we digress…)
Regardless, we read this past week with interest (get it?) of a report wherein Klaros Group — their having analyzed some 4,000 StateSide banks — deduced that 282 (7%) of them are “stressed”, (the word of a co-founder and partner of noted consulting firm, albeit he qualified that hardly is insolvency an imminent issue). Still, Fitch’s Christopher Wolfe (Managing Director and Head of North American Banks) said per a mid-week CNBC(S) piece: “You could see some banks either fail or at least … dip below their minimum capital requirements…” Just something upon which to chew rather than Gold eschew, (which one ought never do), even as its near-term down move looks to continue.
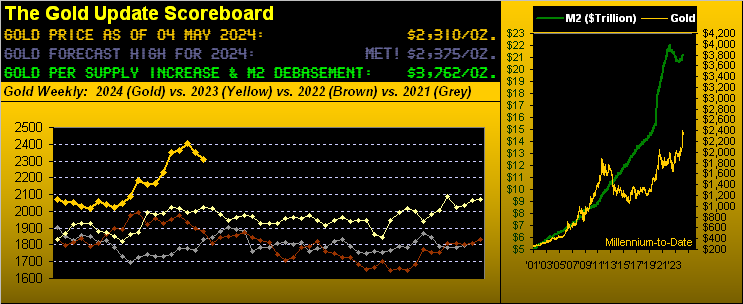
That noted, Gold now through 18 weeks in 2024 recorded for just the third time back-to-back down ones in settling yesterday (Friday) at 2310. And given Gold’s near-term technicals are tilting more negatively, ‘twould appear the 2247-2171 structural support zone as herein cited a week ago can more realistically come into play. Indeed Gold’s EDTR (“expected daily trading range”) is now 44 points and the weekly measure 75 points: so from today’s 2310 ’tis not that far down to at least tap 2247.
And so to Gold’s year ago-to-date weekly bars we go, upon which we’ve placed the green-bounded 2247-2171 support zone. ‘Course that area may be moot should an otherwise waiting trading community get fired up over the next bank default:

“But as you say, mmb, the technicals remain down, eh?“
Near-term that is the case, Squire. In fact, per our linear regression math, the 21-day trends for both Gold and Silver this past week rotated as we anticipated from positive to negative. You can see it “in motion” per the following animated graphic of the precious metals’ respective 21-day trading days (one month) as they progressed from one week ago to now. Again as we’ve oft said: “Follow the Blues instead of the news, else lose your shoes” as clearly depicted here, the trendlines turning negative as the “Baby Blues” fall through their centered 0% axes:

And as you core followers know such that you can keep track, the stance of the “Baby Blues” for all of our markets are updated daily at the website. Too, toward assessing Gold’s negative technical bent, let’s also update price vis-à-vis its smooth valuation line. As we next look below on the left at Gold from three months ago-to-date, the excess of price above its smooth valuation line (borne of price changes relative to those of the five primary BEGOS Markets: Bond / Euro / Gold / Oil / S&P 500) has eroded from more than +200 points now to just +50 points. In this same construct, on the right we’ve the S&P 500, which you sharp-eyed readers shall recall we deemed some two weeks ago as having become “textbook oversold”, when also ’twas certainly low vis-à-vis its smooth valuation line:

Still, whilst Gold near-term (i.e. the trader’s view) had become “too high” and the S&P “too low”, we all (hopefully) know that broadly (i.e. the investor’s view) Gold by currency debasement remains vastly undervalued whilst the S&P 500 by earnings generation continues as immensely overvalued. Oh to be sure, this Q1 Earnings Season for the S&P has thus far reduced its “live” price/earnings ratio from the mid-40s to now 37.7x: but given the low-20s as an “acceptable mean” — especially in this 5% risk-free interest environment — the potential fallout for equities remains massive. Remember: had COVID (and all of its attendant money printing) not occurred, the S&P 500 today by its 50-year regression channel would be ’round the 2900 area, and the investing world very pleased with that level. But priced today at 5128, the “Casino 500” is that namesake. And throughout the S&P’s history as dated from its creation in March 1957, the P/E always reverts to its mean, (hint hint, nudge nudge, wink wink, elbow elbow). Or ad nauseam reprising J. B. Cohen: “…in bull markets the average [P/E] level would be about 15 to 18 times earnings.” Again, we’re now basically double that.
In the midst of all this, the Federal Open Market Committee on Wednesday released their expected “do-nothing” Policy Statement, following which FedHead Jerome Powell said: “I think it’s unlikely that the next policy rate move will be a hike … I think we’d need to see persuasive evidence that our policy stance is not sufficiently restrictive to bring inflation sustainably down to 2% over time. That’s not what we think we’re seeing.”
Here’s what we’re seeing, having herein ruminated since New Year that the Fed potentially need raise rates. Our following updated table summarizes StateSide inflation now through all of the key March measures of the Consumer Price Index (CPI retail inflation), Producer Price Index (PPI retail inflation), and Personal Consumption Expenditures (PCE Fed-favoured inflation). Be it by 12-month summation and/or March itself annualized, red indicates inflation running well ahead of the Fed’s 2% target:

‘Course we all understand that ’tis the Fed’s notorious tradition to be “behind the curve”. And the above table proves it. But the Fed maintains significant credibility, as it is watched, read and parsed word-by-word. The FinMedia suck it all in. The folks managing your money suck it all in. Moreover, ’tis oft thought the Fed is desperate to keeping the stock market from crashing. Also, consider the plight of those aforementioned “stressed” banks, (“No, thanks!”)
But let’s look at what’s happening: Chair Powell desires inflation receding down to “2% over time”; FedFunds have been in the 5.25%-to-5.50% target range since last 26 July: that’s more than nine months ago; how much “over time” is being considered? Or is the sudden, abrupt downturn in the Economic Barometer bang-on-time to aid the Fed’s stead?

This past week, 16 metrics came into the Econ Baro, of which a mere four improved period-over-period. And the cost of labour is on the move: not only did Q1’s Employment Cost Index increase, but Unit Labor Costs — which were flat back in Q4 — lurched +4.7% in Q1. Is it any surprise Payrolls’ growth really slowed in April, Unemployment ticked higher, and the Institute for Supply Management’s Services Index crossed from expansion in March now to contraction? No, ’tisn’t. (Then there’s the “S”-word: stagflation. … but we’re not supposed to say that).
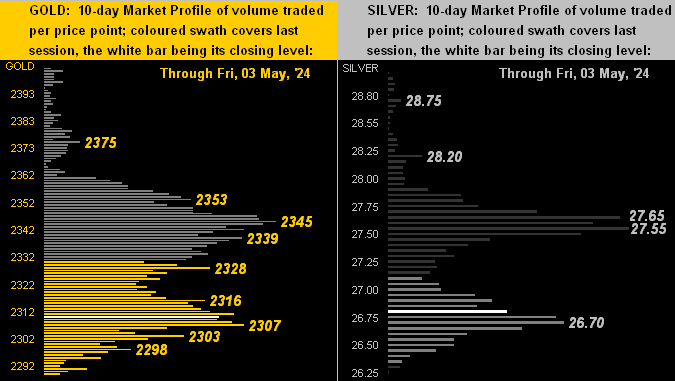
Neither is it a surprise to note all the overhead pricing resistance for the precious metals. Here (below left) is the 10-day Market Profile for Gold with same (below right) for Silver. Volume-dominant price apices are as labeled:
To wrap, we mentioned earlier with respect to the Fed those who fawn over every word, which may well include they who manage your money, i.e. the “pro” you know. But wait, there’s more: hat-tip Bloomy from just over a week ago when the “Casino 500” was weathering a minor correction: “Wall Street Humbled as Fast-Reversing Markets Confound the Pros.” Is that not oxymoronic? Any “pro” worth his or her salt ought hardly be “confounded” by anything the market does, certainly so when it declines from these ridiculously overvalued levels. Certainly stated: rather than “confounded”, a true “pro” ought be “expective” of significant (understatement) downside risk. Right? What are they missing?

“Math skills, mmb?“
Oh Squire, you’re just too good. But be it rate uncertainties, debased currencies, bank failures, “stoopid” equity values, geo-political jitters or the “confounded pro” whose hands are on your money…

…maintain sound reason and your wealth domain with Gold!
Cheers!
…m…
www.TheGoldUpdate.com
www.deMeadville.com
and now on “X”: @deMeadvillePro
********
share
share
share
share
share

Mark Mead Baillie has had an extensive business career beginning in banking and financial services for two years with Banque Nationale de Paris to corporate research for three years at Barclays Bank and then for six years as an analyst and corporate lender with Société Générale.
For the last 22 years he has expanded his financial expertise by creating his own financial services company, de Meadville International, which comprehensively follows his BEGOS complex of markets (Bond/Euro/Gold/Oil/S&P) and the trading of the futures therein. He is recognized within the financial community of demonstrating creative technical skills that surpass industry standards toward making highly informed market assessments and his work is featured in Merrill Lynch Wealth Management client presentations. He has adapted such skills into becoming the popular author each week of the prolific “The Gold Update” and is known in the financial website community as “mmb” and “deMeadville”.
Mr. Baillie holds a BS in Business from the University of Southern California and an MBA in Finance from Golden Gate University.