Gold Forecast: Gold Cycles Warned of Current Decline
 share
share
 share
share
 share
share
 share
share
 share
share
 From my last article posted back in mid-April ("Gold Cycles Move into Topping Range"), Gold has turned south, and is in the midst of a correction with our 72-day time cycle. Though this decline looks to have further to run, it is expected to end up as an eventual countertrend affair - due to the position of the larger-degree waves.
Gold's Dominant 72-Day Cycle
As in past articles, the last low for our 72-day wave was made back in mid-February, later confirmed by the subsequent reversal above the 2086 figure. In terms of price, that action triggered a 10-14% rally for the metal, which was easily met with the action that followed.
Here again is our 72-day time cycle for Gold:
From my April 14th article: "the average rally phases with this 72-day wave were noted as having taken 39 trading days before topping, which favored higher highs into April 9th or later. With that, the highest high seen was Friday's (April 12th) peak of 2448.80, which puts us into the expected topping range with this cycle. Once this 72-day wave turns, a decent correction should be expected to unfold."
As originally noted in article back in March, the average rallies with this 72-day cycle - when coming off a 'higher-low' - took around 39 trading days before completing. This made the inference for strength into April 9th or later, which was seen - with the highest high made with the April 12th tag of 2448.80 (June, 2024 contract).
There were technical signs that Gold was peaking back on April 12th, with the main one of these being our Gold Timing Index, shown on the chart below:
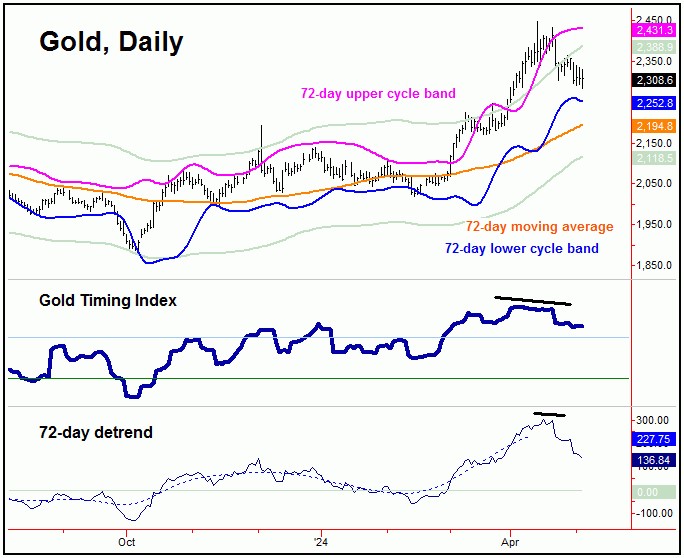
One of the things that we look for at Gold cycle tops (such as with our 72-day wave) is a divergence between our Gold Timing Index, and the actual price of the metal. Typically, the indicator and the price of Gold will move in tandem.
Having said the above, when Gold spikes to a higher price high - and is accompanied by a divergence in our Gold Timing Index - the market is often near a peak of importance. And, since the last peak was expected to come from our 72-day time cycle, the assumption was that this wave was topping - as per my last article from mid-April.
Going further, since the long side was at higher risk - based on the above divergence signal - we managed to exit our open long GLD position on April 12th, the exact day of the high for the last swing. With that, we will be looking for indications to re-enter the long side going forward, based on the position of our 72-day cycle.
Potential Downside & Expected Pattern
In terms of price, following my rule that a valid cycle will see a reversion back to a moving average of the same length better than 85% of the time, the downside 'risk' is back to the 72-day moving average in the coming weeks. Even said, the decline into the next 72-day trough is unlikely to be a straight shot down (though anything is possible).
Having said the above, if the downward phase of our 72-day wave is to remain intact into the late-May to early-June window, this would tell us to expect any short-term rallies to end up as countertrend. With that, we are in the range for a short-term low to develop, coming from a smaller-tracked 20-day cycle, shown in the chart below:
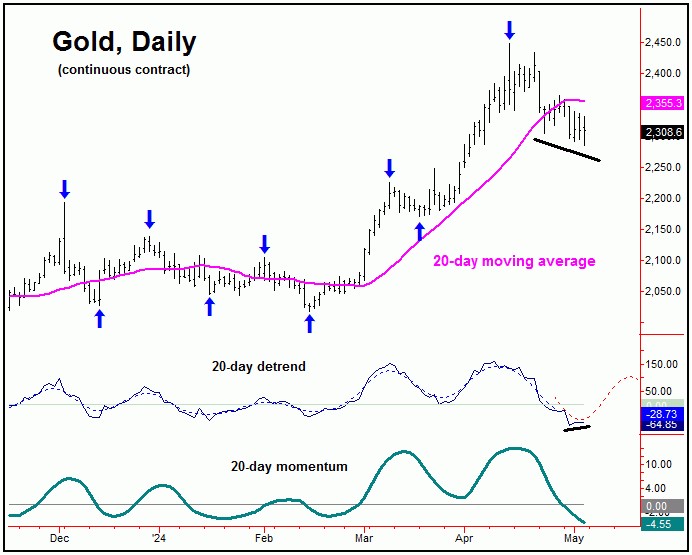
With the above said and noted, a short-term rally with the 20-day wave could see the 20-day moving average acting as the magnet - and may also act as resistance, to a move expected to end up as countertrend, due again to the position of our 72-day wave. If correct, a drop back to lower lows would play out into late-May to early-June.
Stepping back then, if Gold is making lower lows for the 72-day cycle downward phase into late-May to early-June, we will need to be on the lookout for indications of a bottom forming with this wave, as what follows is expected to be another sharp rally of some 10-14% off the low, lasting well into the Summer of this year.
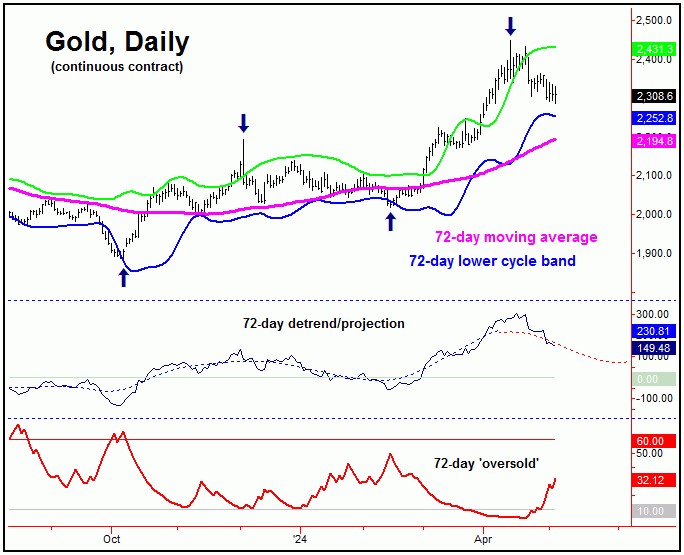
With that, we can look at a chart of our 72-day wave once again, this time adding in both our Gold Timing Index - as well as our 72-day 'oversold' indicator:
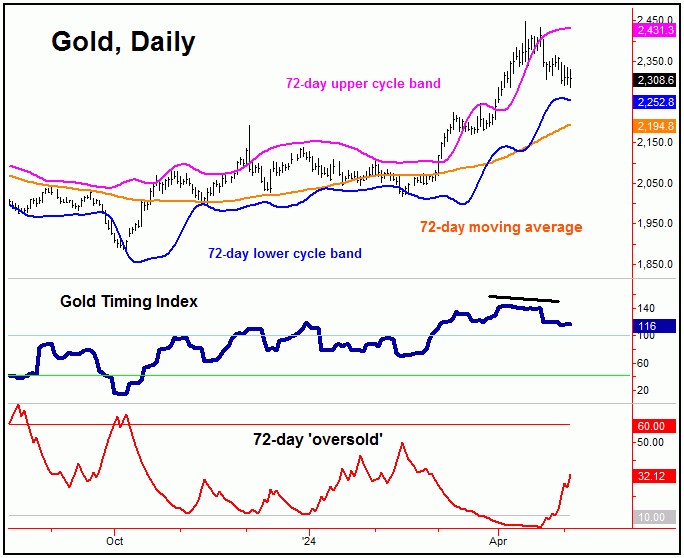
What we like to see as our 72-day wave bottoms out is either (1) a drop below the 40 level in our Gold Timing Index, and/or (2) a spike above the 72-day 'oversold' indicator's upper reference line of 60. If either (or the combination of the above) are seen going forward, this would be our indication to re-enter the long side, in the anticipation of a sharp 10-14% rally playing out into this Summer.
Jim Curry
The Gold Wave Trader
Market Turns Advisory
http://goldwavetrader.com/
http://cyclewave.homestead.com/
*******
share
share
share
share
share